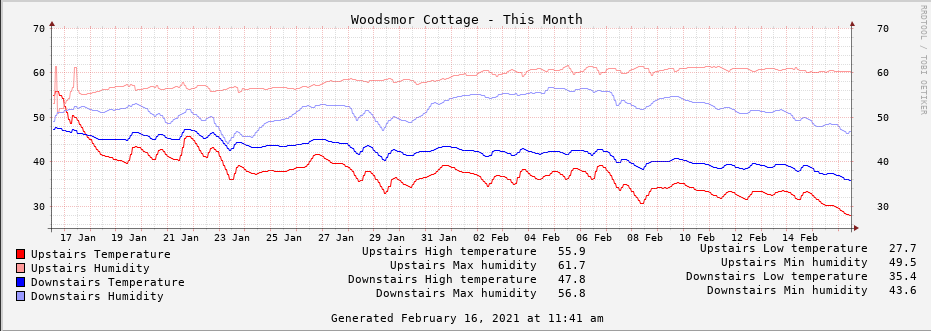
I decided to use the rrd (Round Robin Database) to hold the temperature and humidity data from the sensors. The rrd is designed to hold the data in archives that are defined when the database is created. New data will roll in, and old data will roll out, maintaining the time period data for each archive. I’ve defined daily, weekly, monthly, and yearly archives. It’s probably more than I will ever need, but it doesn’t take much space so why not.
With that said, let’s take a look at the database definition.
The file is marked executable, and this line tells the OS what interpreter to use.
1 2 3 4 | rrdtool create temp_humidity.rrd \
--start "12/10/2020" \
--step 300 \
|
These lines give the database a name (temp_humidity.rrd), define the start date (12/10/2020), and define how often data should be expected to be loaded into the database (every 300 seconds).
1 2 3 4 | DS:uth_dht22:GAUGE:1200:-10:100 \
DS:uhm_dht22:GAUGE:1200:-10:100 \
DS:dth_dht22:GAUGE:1200:-10:100 \
DS:dhm_dht22:GAUGE:1200:-10:100 \
|
These lines define 4 data fields, named uth_dht22, uhm_dht22, dth_dht22, and dhm_dht22. GAUGE means that the values are stored directly as provided. The 1200 value is the number of seconds the database will wait for a new value – if no data is loaded, an empty set of values will be inserted. This is so that the graphing tool, which we will get to later, will have a complete set of data to display. The final two values define the valid range of data, in this case from -10 to 100.
1 2 3 4 | RRA:AVERAGE:0.5:1:288 \
RRA:AVERAGE:0.5:6:336 \
RRA:AVERAGE:0.5:24:372 \
RRA:AVERAGE:0.5:144:732 \
|
These lines define four archives, daily, weekly, monthly, and yearly. This set of archives will hold average data for the four data fields. 0.5 is a value used to manage consolidation of the data items – this is recommended by the author so I used the recommended value here. The next field is the number of data points that will be used to construct a consolidated data point. The final field is the number of consolidated data points that will be retained in the archive.
The final two parameters can be confusing, let’s look at them more closely.
For the first archive (daily), each data point is averaged, and 288 are retained. Since we are sampling every 300 seconds, we will get 288 samples per day.
For the second archive (weekly), we average 6 data points to a single data point, and 336 are retained. By consolidating 6 data points into 1, we will have 48 consolidated data points per day. Each week will then have 48 * 7 or 336 data points per week.
For the third archive (monthly), we average 24 data points to a single data point, and 372 are retained. By consolidating 24 data points into 1, we will have 12 consolidated data points per day. Each month will then have 12 * 31 or 372 data points per month.
For the fourth archive (yearly), we average 144 data points to a single data point, and 732 are retained. By consolidating 144 data points into 1, we will have 2 consolidated data points per day. Each year will then have 2 * 366 or 732 data points per year.
1 2 3 4 5 6 7 8 | RRA:MIN:0.5:1:288 \
RRA:MIN:0.5:6:336 \
RRA:MIN:0.5:24:372 \
RRA:MIN:0.5:144:732 \
RRA:MAX:0.5:1:288 \
RRA:MAX:0.5:6:336 \
RRA:MAX:0.5:24:372 \
RRA:MAX:0.5:144:732 \
|
The final lines are almost duplicates of the average archives, except that they store minimum (MIN) and maximum (MAX) values.
Here is the complete script.
1 2 3 4 5 6 7 8 9 10 11 12 13 14 15 16 17 18 19 20 21 22 | #!/bin/bash
rrdtool create temp_humidity.rrd \
--start "12/10/2020" \
--step 300 \
DS:uth_dht22:GAUGE:1200:-10:100 \
DS:uhm_dht22:GAUGE:1200:-10:100 \
DS:dth_dht22:GAUGE:1200:-10:100 \
DS:dhm_dht22:GAUGE:1200:-10:100 \
RRA:AVERAGE:0.5:1:288 \
RRA:AVERAGE:0.5:6:336 \
RRA:AVERAGE:0.5:24:372 \
RRA:AVERAGE:0.5:144:732 \
RRA:MIN:0.5:1:288 \
RRA:MIN:0.5:6:336 \
RRA:MIN:0.5:24:372 \
RRA:MIN:0.5:144:732 \
RRA:MAX:0.5:1:288 \
RRA:MAX:0.5:6:336 \
RRA:MAX:0.5:24:372 \
RRA:MAX:0.5:144:732 \
|
Next, we’ll go back to python to query the sensors and store the data in the rrd database we’ve just defined.


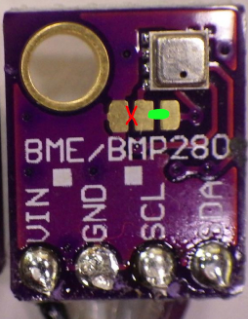
 We also need to make a small alteration to one of the sensors to change it’s address on the i2c bus. In the following image, the red mark indicates the we are removing the connection between the left and center pad, and adding a connection from the center pad to the right pad. We are only altering one of the two sensor boards in this manner. The unaltered sensor will have bus address 0x76, and the altered sensor will have address 0x77. The test script below is coded so that the upstairs sensor is the unaltered one, and the altered sensor is the downstairs sensor.